Customer journey mapping: case study
Table of Contents (Click to show/hide)


Developing Business and Social Innovation through Creativity and Foresight Methods
CustomerJourney Mapping (CJM) is designed to create a deeper understanding of customer’s behaviour by seeking impactful solutions to enhance the customer experience. Although CJM requires the analysis of both online and offline interactions, digital technology plays a primary tracking role in customer journey mapping. This innovative approach is widely used to serve marketing purposes thus providing valid insights for elevating touch points by innovation and creativity (Rosenbaum, Otalora & Ramírez 2017). This essay argues that e-commerce CJM benefits further optimisation in e-commerce by service innovation. This essay also narrates the background and history of CJM will be revealed and provide a compelling example of how CJM innovates and elevates the customer’s journey in e-commerce. As such, the essay focuses on the e-commerce customer shopping journey and the provisionof critical insights.
The Background of Customer Journey Mapping
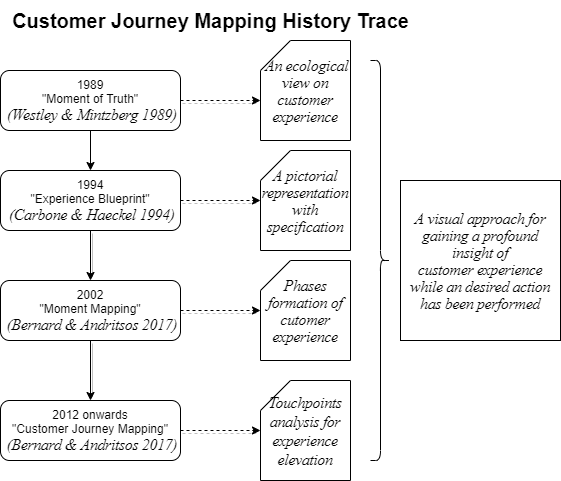
Customer journey mapping is a visual approach for gaining a profound customer experience insight while an expected action gets performed(Marquez, Downey & Clement 2015). According to Kalbach (2020), Jan Carlzon’s concept of ‘moments of truth’ firstly reveals the fundamental idea of touch points – an advocate of ecological view on customer experience(Westley & Mintzberg 1989). In 1994, the concept of experience blueprint was explained as “a graphic illustration of experience trace to be customised, along with the attachment of personal characters” (Carbone & Haeckel 1994). With that in mind, the concept of “moment mapping” was introduced in 2002 to form the phases of the customer experience (Kalbach 2020; Bernard & Andritsos 2017). The customer journey mapping has further evolved and made an influential impact from 2012 –businesses now combine with design thinking with customer journey mapping to bring the experience to life (Bernard & Andritsos 2017) (Refer to Figure 1).
A customer journey map illustrates the sequence of events that customers may interact with or have conducted during the purchase process (Rosenbaum, Otalora & Ramírez, 2017). It uses arrows, text and graphic elements to map the steps of the journey (Kalbach 2020). Every customerinteraction is considered as a touchpoint that represents an opportunity for the. organisation to take the initiative to optimise the interaction (Marquez, Downey & Clement 2015). The sequence of touchpoints horizontally connects together with a process timeline. Thus, the formation of a customer journey map is accomplished (Refer to Figure 2).
Customer satisfaction and experience are vital to business growth, as 80% of business decisions are based on customer needs (Temkin, McInnes & Zinser 2010). With the development of digital technology, a customer is able to express their thoughts, wants and needs without restriction in time, devices and location (Anderl et al. 2020). As such, the utilisation of CJM benefits the business in the following ways:
- The visualisation of the customer journey highlights the various stages and touchpoints of a given task. gain a better understanding (Marquez, Downey & Clement 2015).
- The understanding is proven to be beneficial for process innovations to better match the user. expectations (Willott 2020).
- User engagement can be improved by identifying the “moment of truth” to increase user engagement (Lucidchart 2017).
- Have cost by eliminating ineffective touchpoints and enhancing the future return on investment (Lucidchart 2017).
Although CJM enables businesses to access and address any misalignment with delivery, there are some drawbacks in relying on journey maps that may result in the failure to understand and analyse the quality of customer expectations (Anderl etal. 2020):
- Despite the benefit of a comprehensive understanding of the customer journey, value is always assumed to be attributed to the last action before the conversion. Nevertheless, the credit attribution received increased concerns in terms of the importance of the channel and the complexity of the user journey (Berman 2015).
- The fixed journey map is unable to cope with the complexity of the user journey. It is also not giving any weightage to external criteria such as implementation, time-to-market, cost and context (Klaidman 2016; Regalix 2019).
- Journey biases and the inconsistency between “the moment of truth” and the pain points (Klaidman 2016) (Refer to Appendix A).
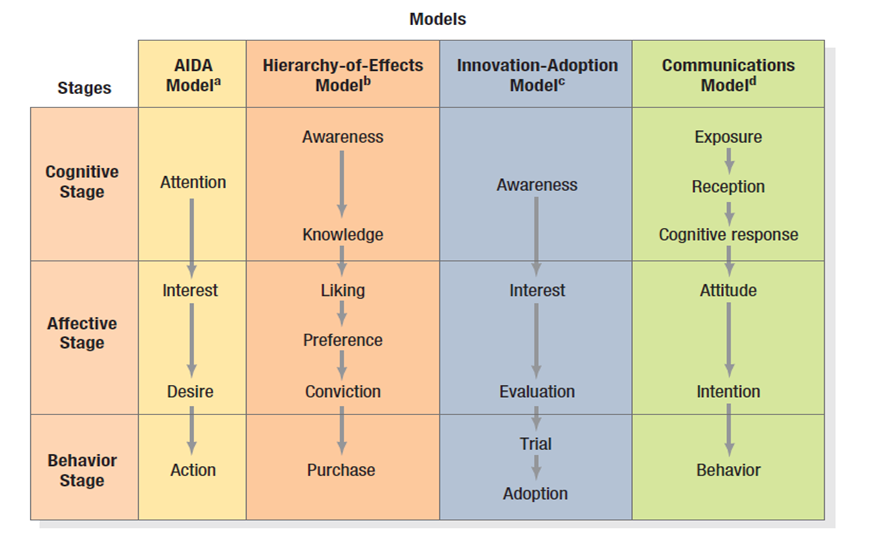
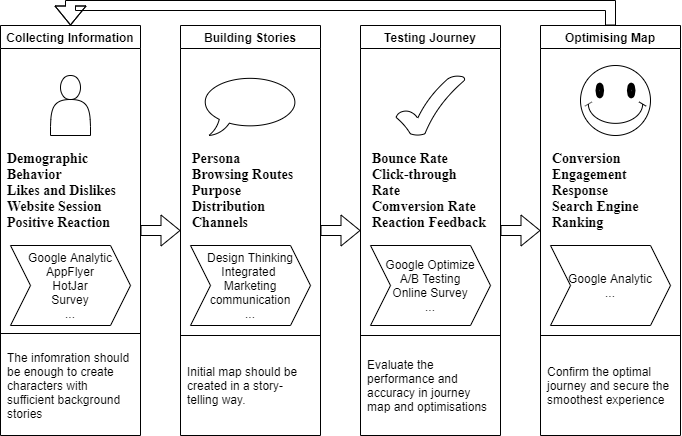
Customer journey mapping follows the AIDA model (awareness, interest, desire, and action) (Willot, 2020) (Refer to Figure 3) and provides a useful starting point for understanding the cognitive, affective, and physical responses. of customers (Følstad & Kvale 2018). Therefore, businesses can identify each step and apply analysis to evaluate touchpoints (Figure 4). Digital tracking tools such as AppsFlyer, Google Analytics and Facebook Analytics are the primary means to pixel-tracking customer movement from the beginning to the end. end (Temkin, McInnes & Zinser 2010) (Refer to Appendix B).

Using Customer Journey Mapping for Innovation
(Note: the CJM example listed below is an e-commerce workshop in the author’s company, which will be referred to in this essay as “CompB.“)
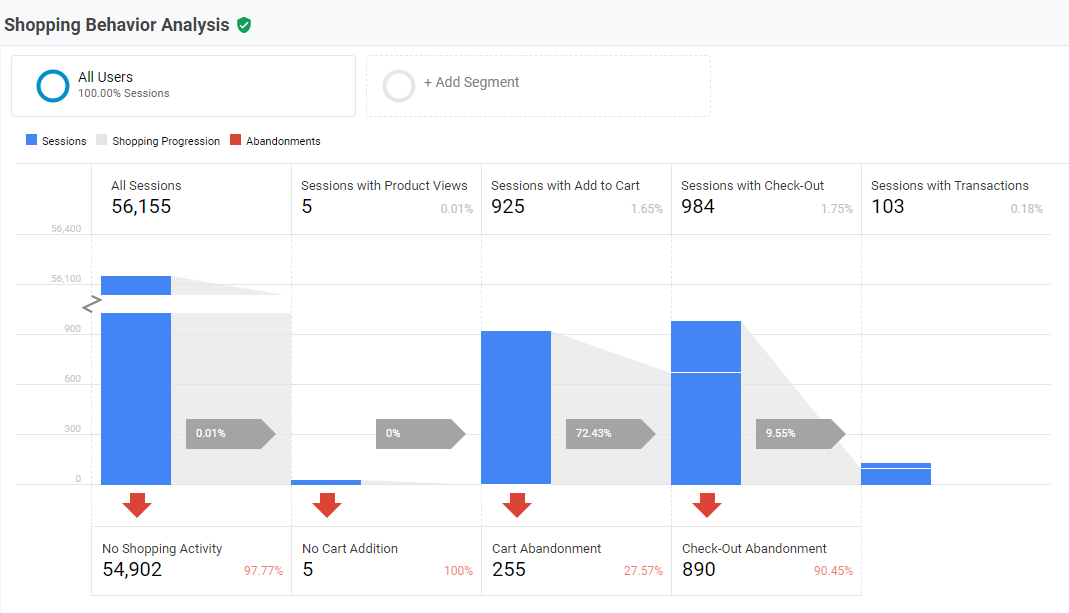
Personalisation is proven to be the most popular trend in user experience optimisation (Berridge 2019). Subjective speculation does not truly reflect the authentic experience. Customer journey requires advanced analytics technology to produce effective results (Google 2020). An innovative optimisation process is demonstrated by CompB — an e-commerce retail business’s CJM workshop that the author supervised (see Figure 5). By analysing the behaviour funnels, CompB can differentiate valuable traffic sources and identify the funnel with the highest abandonment rate. Furthermore, HotJar and Google Analytics enable the company to investigate user browsing behaviour individually. Analysis of company “B”’s success story revealed two key behaviours:
- 1. A missing-click area was found on the category page’s landing strip banner.
- 2. A “call-to-action” might increase clicks to more in-depth pages.
As a result, CompB ran two rounds of A/B testing to address the missing clicks (see Figures 5 and 6):
- 1. Remove the landing strip banner on major categories.
- 2. Add a “call-to-action” to the homepage banner.
The company was able to detect a rise in clicks on the homepage banners. However, no significant changes in user experience were observed after removing the category landing strip banner (see Appendix C).

Conclusions
Customer journey mapping offers opportunities to understand and optimise user experience across interactions. The map enables CompB to learn about its traffic status and identify the pain points in the “homepage–category page–product page” funnel touchpoints. The optimisation applied did not entirely improve the website experience; however, the slight improvement in user clicks and bounce rate metrics can be observed. As such, the website navigation function is enhanced. In this example, two key insights are revealed:
A comprehensive, integrated journey map is difficult to create.
Each user has a unique journey (Rosenbaum, Otalora & Ramírez 2017). They can interact through different channels at various times. It is therefore impossible to map all customer journeys, but measuring the major traffic sources will help the organisation become more effective in focusing on primary channels for optimisation.
Optimisation requires design thinking and testing
Using design thinking to handle optimisation challenges has proven useful in aligning with user expectations (Liedtka 2014). CompB achieved this by creating a user-oriented strategic journey map and employing different designs to enhance website navigation, communication, and engagement. Customers were then able to experience a smooth purchase process in a more aligned and storytelling manner.
In conclusion, customer journey mapping is a comprehensive and detail-oriented marketing tool that links the organisation and its users in terms of interaction. Despite its limitations in credit attribution, organisations and businesses will greatly benefit from creating a client-focused journey study. With this in mind, user experience should be the ultimate principle in strategic business development.
REFERENCES
Anderl, E., Becker, I., von Wangenheim, F., & Schumann, J. (2020). “Mapping the customer journey: Lessons learned from graph-based online attribution modelling”.
Bernard, G., & Andritsos, P. (2017). “A process mining-based model for customer journey mapping”, Forum and Doctoral Consortium Papers presented at the 29th International Conference on Advanced Information Systems Engineering (CAiSE 2017), vol. 1848, pp. 49-56.
Berridge, R. (2019). “eStar Chief Client Officer gets personal: The rise of product personalisation - Power Retail”, Power Retail. Viewed February 1, 2020. <https://powerretail.com.au/editorial-2/estar-chief-client-officer-gets-personal-the-rise-of-product-personalisation/>
Carbone, L., & Haeckel, S. (1994). “Engineering customer experiences”, Marketing Management, vol. 3, no. 3, pp. 8-19.
CompB. (2019). Customer journey mapping project (October-December), Sydney: CompB.
De Graaf, J. (2020). “Ask a researcher: How do needs drive intent?“, Think with Google. Viewed January 19, 2020. <https://www.thinkwithgoogle.com/consumer-insights/consumer-needs-research>
Følstad, A., & Kvale, K. (2018). “Customer journeys: A systematic literature review”, Journal of Service Theory and Practice, vol. 28, no. 2, pp. 196-227.
Google. (2020). “User Explorer - Analytics Help”, Support.google.com. Viewed February 1, 2020. <https://support.google.com/analytics/answer/6339208?hl=en>
Kalbach, J. (2020). “Mapping experiences”, O’Reilly Online Learning. Viewed January 26, 2020. <https://www.oreilly.com/library/view/mapping-experiences/9781491923528/maex_ch10.xhtml>
Klaidman, S. (2016). “The trouble with customer journey maps - Middlesex Consulting”, Middlesex Consulting. Viewed January 292020. <https://middlesexconsulting.com/the-trouble-with-customer-journey-maps/>
Liedtka, J. (2014). “Innovative ways companies are using design thinking”, Strategy & Leadership, vol. 42, no. 2, pp. 40-45.
Lucidchart. (2017). “How to create a customer journey map | Lucidchart”, Lucidchart.com. Viewed January 29, 2020. <https://www.lucidchart.com/blog/how-to-build-customer-journey-maps>
Marquez, J., Downey, A., & Clement, R. (2015). “Walking a mile in the user’s shoes: Customer journey mapping as a method to understanding the user experience”, Internet Reference Services Quarterly, vol. 20, no. 3-4, pp. 135-150.
Regalix. (2019). “Customer journey maps: The good, the bad, and the ugly – Regalix”, Regalix.com. Viewed January 29, 2020. <https://www.regalix.com/insights/customer-journey-maps-good-bad-ugly>
Rosenbaum, M., Otalora, M., & Ramírez, G. (2017). “How to create a realistic customer journey map”, Business Horizons, vol. 60, no. 1, pp. 143-150.
Temkin, B., McInnes, A., & Zinser, R. (2010). Mapping the customer journey, Forrester Research. Viewed January 26, 2020. <http://crowdsynergy.wdfiles.com/local--files/customer-journey-mapping/mapping_customer_journey.pdf>
Westley, F., & Mintzberg, H. (1989). “Visionary leadership and strategic management”, Strategic Management Journal, vol. 10, no. S1, pp. 17-32.
Willott, L. (2020). “How to create your customer journey map - Customer Thermometer”, Customer Thermometer. Viewed January 292020,<https://www.customerthermometer.com/customer-feedback/how-to-cre
APPENDICES
Appendix A: “A moment of truth” and pain point
A moment of truth occurs whenever a customer interacts with the organisation (Klaidman 2016). Examples include performing a search for an answer, ordering a takeaway through the Menulog app, or even switching on a home appliance. However, these actions only represent a sequence of events that customers perform. They do not explain the pain point that triggers the bounce. The reasons behind this are varied and complex; it might be that the page layout creates an unpleasant experience for customers, or the graphics are not navigational and make customers feel confused. Customer journey mapping can outline a series of “moments of truth,” but it’s challenging to identify the specific pain point causing customers to exit. It is recommended to use design thinking and A/B testing to develop the key capabilities for revolutionary innovators and a potential source of sustainable competitive advantage (Bernard & Andritsos 2017).
Appendix B: How to create a customer journey map
Production of a customer journey map requires the following steps (Bernard & Andritsos 2017):
- Collect internal insights;
- Develop initial hypotheses;
- Research customer processes, needs, and perceptions;
- Analyse customer research; and
- Map the customer journey.
Identifying customer journey stages and defining the customer personas are the essential starting points in the mapping process. It requires the organisation to gather the insights and build up profile blocks based on demographics, background, responses and behaviours. With integrated information, the organisation will be able to understand and define customer goals. Once the journey channels are set, the initial journey map can be created for testing and experimentation (Willott 2020).
Appendix C: CompB’s user journey mapping and optimisation
(Note: CompB in the example is a disguise for the business that the author works for, which is referred to in this essay as “CompB”.)
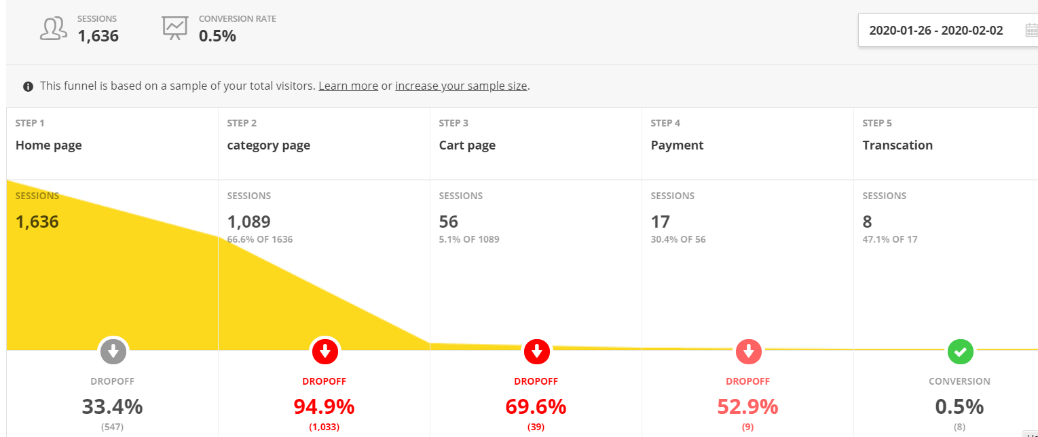
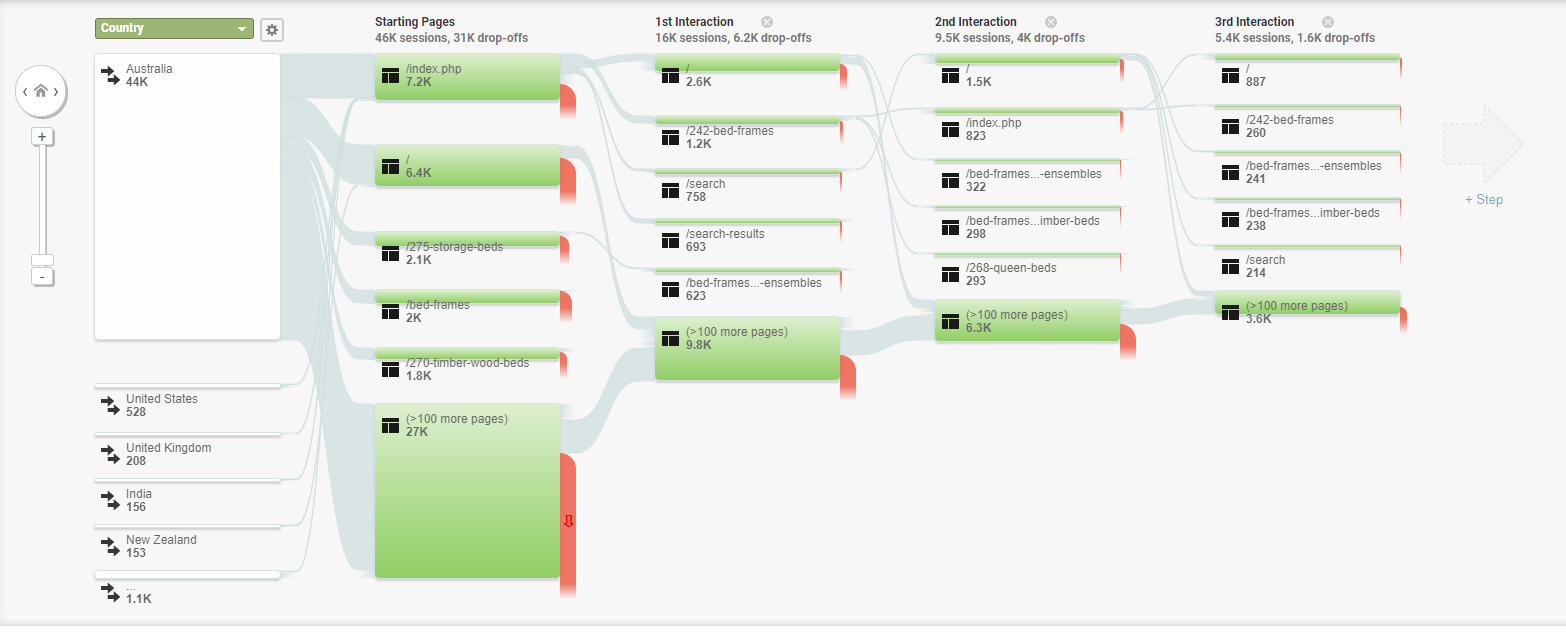
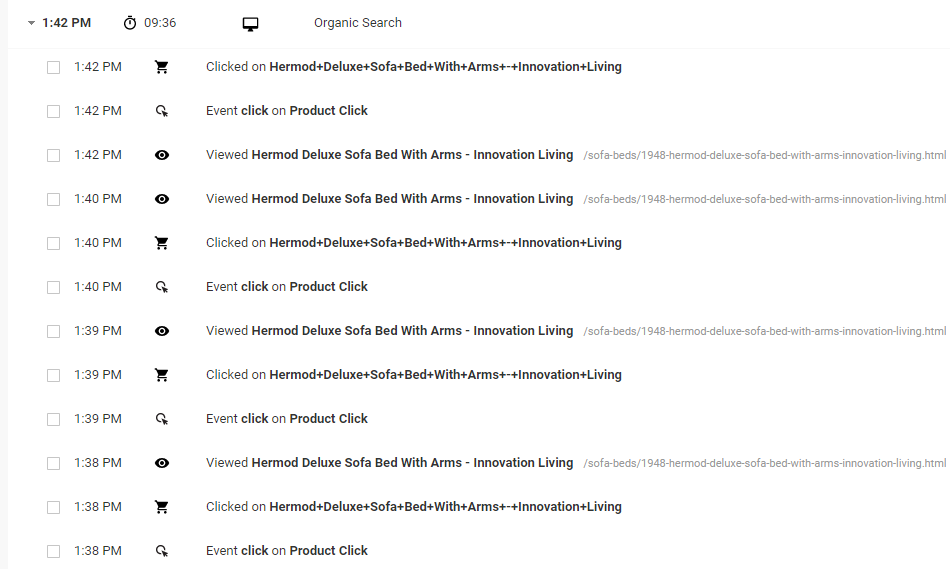
Funnel map is one of the common user journey maps that demonstrates the user journey by showing traffic volume. By using Google Analytics and HotJar (Figure 7 and Figure 8), CompB (2019) found that there is a significant drop in two funnels: a) Homepage to any deeper pages, and b) Category page to product page. The lost traffic resulted in low “add-to-cart” actions. To understand the real scenario, CompB pulled out recordings and examined the user experience case by case (Refer to Figure 8 and Figure 9).
After analysing the recordings and heatmaps, CompB (2019) found that people tend to use the search bar on the homepage instead of clicking banners. Additionally, some missing clicks are concentrated in the landing strip banner area. The findings suggest that users might find the banners confusing, which could be potential pain points. Therefore, an A/B testing was conducted to validate this theory.